

Adding Content: Shapes, Charts, Diagrams, and Media
This guide teaches how to put real content on a slide and place it exactly. After it you will be able to draw and style shapes, add WordArt, build a chart from the numbers you enter, drop in a diagram to explain a flow or a structure, place images and media, write live mathematical notation, and then align, distribute, group, and layer everything with pixel precision. It is the guide for anyone who has spent an evening nudging text boxes toward alignment: the tools here end that work.
Insert Content from the Editor
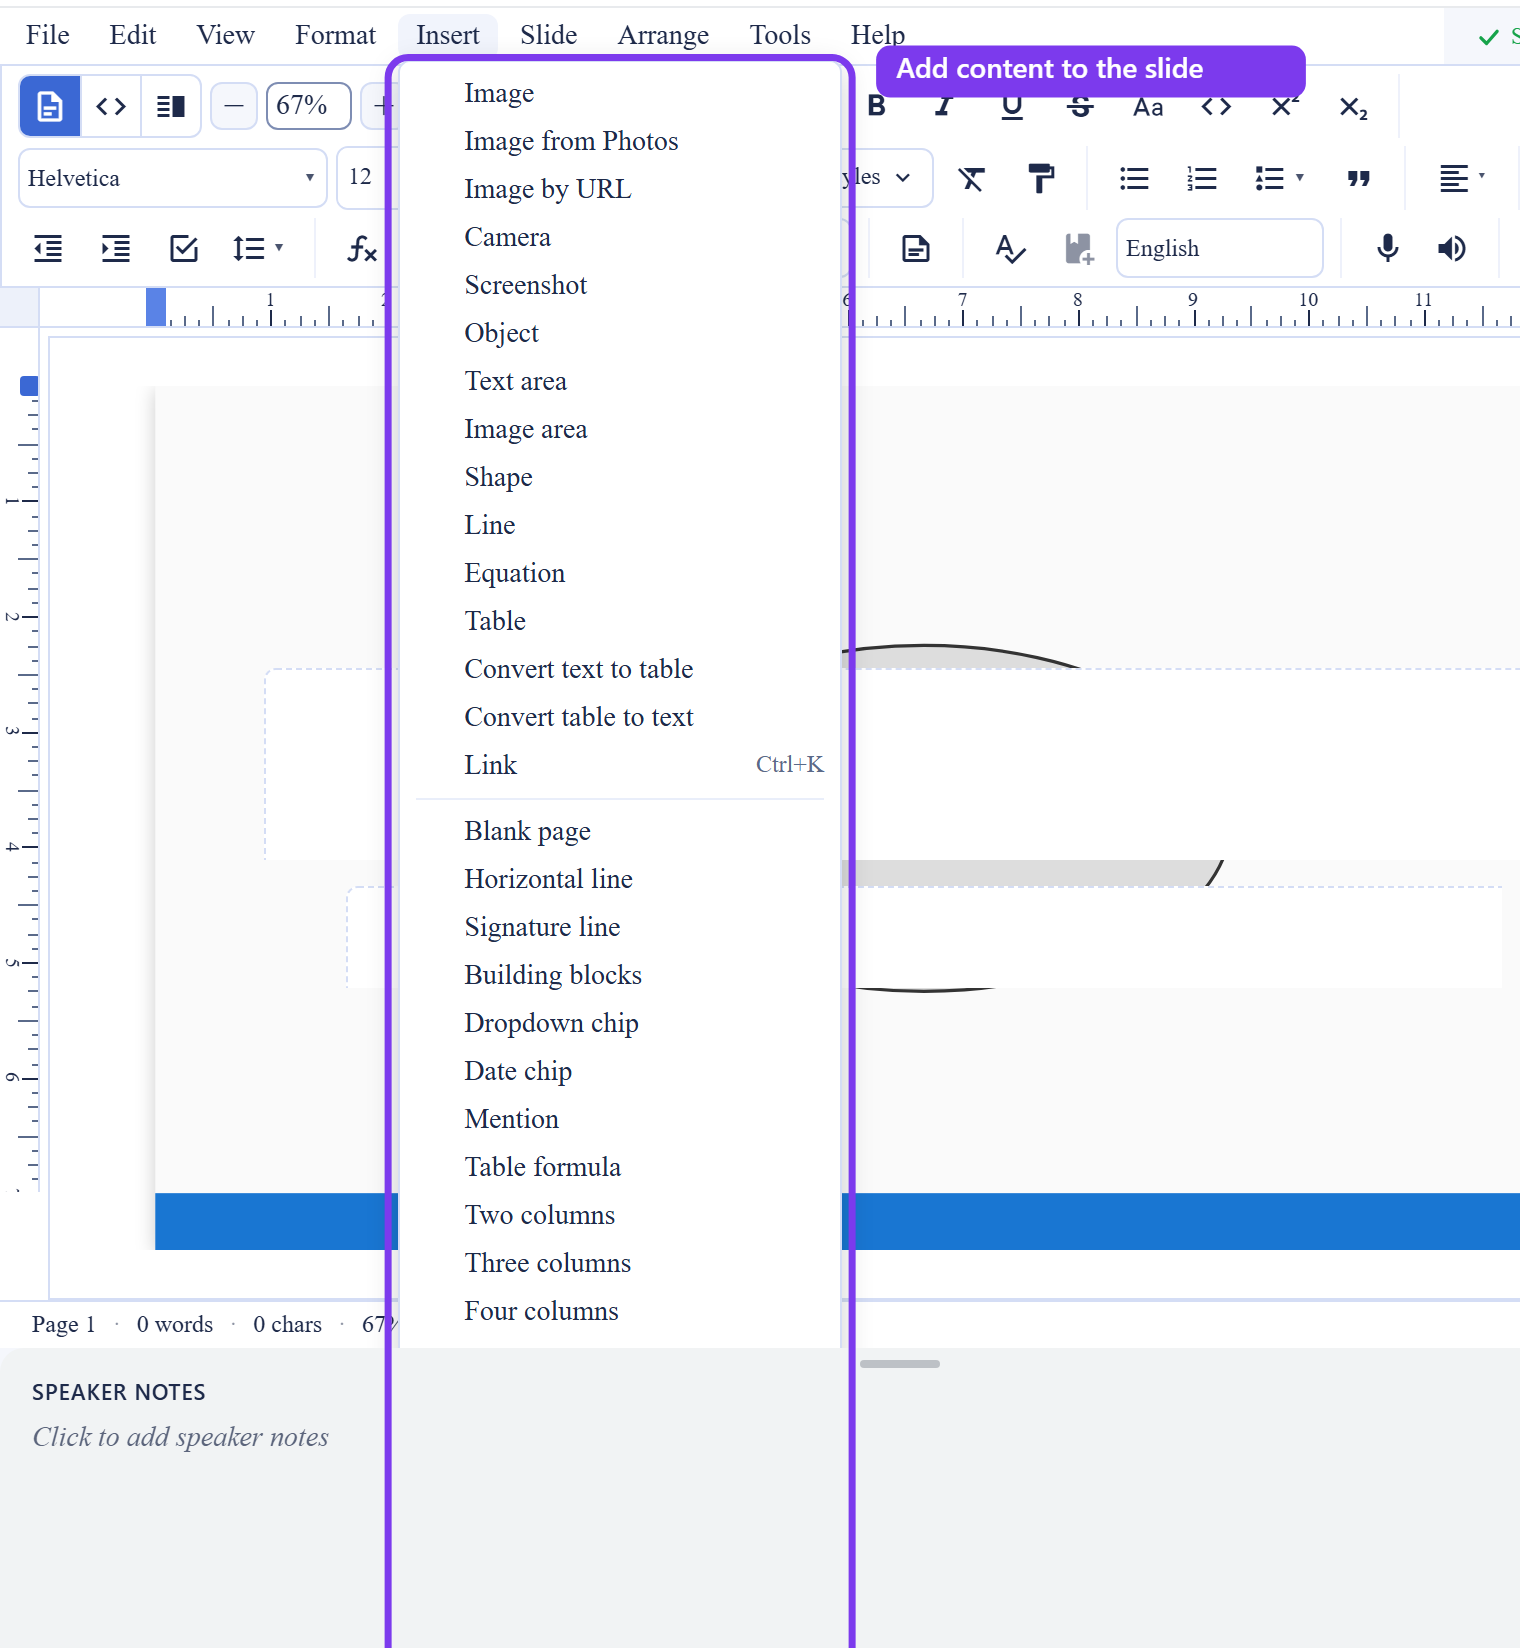
After this section you will know what you can put on a slide and where it comes from. A slide is a canvas of positioned layers, and you add each kind of content from the editor. Because the deck is built on the same editor as Backbuild Docs, the insert dialogs are the ones you already know, surfaced on the slide canvas.
- Shapes: draw rectangles, rounded rectangles, ellipses, and freeform paths, and style them with fills, strokes, and corner radii.
- WordArt: add stylized display text as a design element, for a cover title or a callout.
- Charts: insert bar, column, line, and pie charts that render on the slide from values you enter.
- Diagrams: insert a built-in process, hierarchy, cycle, or grid diagram scene to explain a sequence or a structure.
- Images: place images on a slide, including pictures from your workspace Photos library, so a shared, managed asset library is one click away instead of buried in a drive.
- Video and audio: embed video and audio on a slide for a talk that needs a clip or a soundtrack.
- Live math: write live LaTeX mathematical notation using the same math engine as Backbuild Docs, which is what a technical or academic talk needs on a slide.
Charts Built From Your Numbers
After this section you will put an accurate chart on a slide that you, not a model, control. A chart renders from the values you enter. You choose the chart type, bar, column, line, or pie, and supply the data, and the chart draws from exactly those numbers. This matters most where accuracy is the whole point: a board pack, a KPI review, or a market analysis where a fabricated figure is worse than no figure at all. The chart is author-driven, so the numbers on the slide are the numbers you put there.
Diagrams for a Flow or a Structure
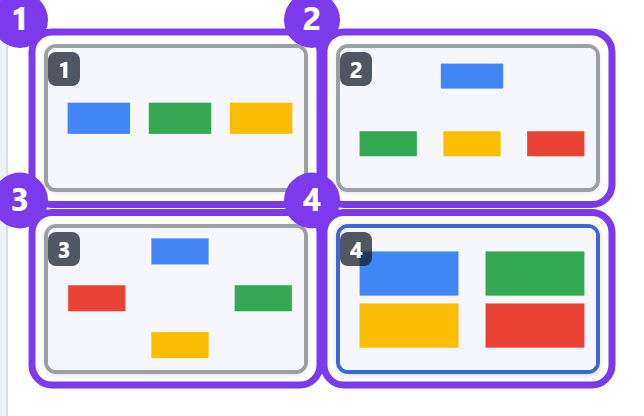
After this section you will explain a process or a hierarchy with a built-in diagram. Insert one of four diagram scenes and it appends to the active slide as editable shapes you can then restyle and rearrange:
- Process: a left-to-right sequence of steps, for a workflow or a customer journey.
- Hierarchy: a top-down tree, for an org chart or a decomposition.
- Cycle: a loop of stages, for a recurring or circular process.
- Grid: a matrix of cells, for a comparison or a framework.
These built-in diagram scenes are part of Backbuild Slides on every plan and live directly on the slide. They are distinct from the separate Diagrams app listed on the pricing page, which is a dedicated whiteboard-style canvas coming soon; the diagram scenes here are available now, inside the deck.
Non-Destructive Composition
After this section you will layer and adjust objects without ever damaging the original. Objects on a slide compose non-destructively: an adjustment changes how an object is rendered, not the object itself, so you can always dial it back. Set an object's opacity, choose a blend mode, lock an object so it cannot be moved by accident, or hide it while you work on what is behind it. Crops, masks, and image adjustments apply at render time, which means the underlying image is never cut, and you can revisit the crop later.
Arrange, Align, and Distribute
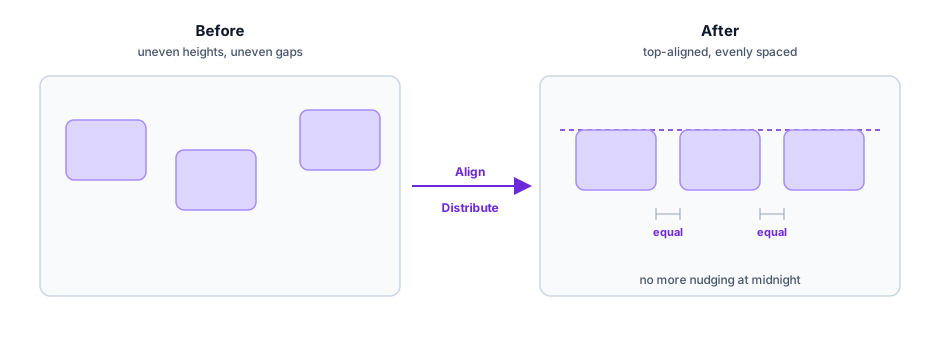
After this section you will place objects exactly, and never nudge a text box by hand again. The Arrange tools give a slide the precision a designer expects:
- Layer order: bring an object forward or send it back to control what sits on top.
- Align: snap objects to a page edge or center them, horizontally or vertically.
- Distribute: select several objects and space them evenly in one action, instead of eyeballing the gaps.
- Rotate and flip: rotate an object by ninety degrees either way, or flip it horizontally or vertically.
- Group and ungroup: combine objects into a group so they move and scale as one, and ungroup to edit a piece.
Between align, distribute, and group, the late-night work of dragging text boxes into rough alignment is replaced by a click that lines them up exactly.
Live Math on a Slide
After this section you will present real mathematics without an image of an equation. A slide can carry live LaTeX math rendered by the same engine as Backbuild Docs, so an equation on a technical or academic slide is real, crisp typography that scales, not a screenshot. This is the reason a researcher can build a conference talk in the same project as the paper it comes from.
Does the AI invent the numbers in my charts? No. A chart renders from the values you enter. You supply the data and the chart draws exactly those numbers, so the figures on the slide are yours. Where an AI agent helps build a deck, it lays down structure and styling; the numbers and words stay under your control. See AI Assistance, the API, and Agents.
Can I use images from a shared library instead of hunting a drive? Yes. When you insert an image you can pull from your workspace Photos library, so a managed, shared asset library is available inside the editor rather than scattered across folders and downloads.
Are the built-in diagrams the same as the Diagrams product on the pricing page? No. The process, hierarchy, cycle, and grid scenes here are built into Backbuild Slides and available now, on the slide. The standalone Diagrams app is a separate, dedicated canvas that is coming soon.
If I crop or adjust an image, do I lose the original? No. Crops, masks, and adjustments apply when the slide renders, not to the stored image, so you can always change or remove them later.
Where to Go Next
- Transitions, Animations, and Speaker Notes: animate the objects you just placed and reveal them one build at a time.
- Building a Deck: Slides, Themes, and Layouts: give the deck a consistent look and save your slide as a template.
- Importing and Exporting: take the finished deck out to PowerPoint, OpenDocument, PDF, or an image.