

Editor Extensions
The Backbuild Prove extension brings formal verification directly into your editor with inline diagnostics, real-time feedback, and automatic re-verification on save. This page teaches the Visual Studio Code extension in full and lists the other editors Prove supports.
After this page you will be able to install and sign in to the extension, read inline diagnostics and CodeLens, use verify-on-save and hover, work from the Backbuild sidebar, configure the extension, and find the right extension for your editor.
The Prove editor extensions are part of Backbuild Prove, which is launching soon. Join the waitlist for access at launch.
Installation
The extension is available on both the VS Code Marketplace and Open VSX. This means it works with:
- Visual Studio Code
- Cursor
- Windsurf
- Any editor that supports VS Code extensions or Open VSX
Search for Backbuild AI in the Extensions panel, or install from the command line:
code --install-extension GableDigitalSolutions.backbuild-vscodeAuthentication
After installing, sign in with your Backbuild account:
-
Open the Command Palette (
Ctrl+Shift+P/Cmd+Shift+P). - Run Backbuild: Sign In.
- Complete the OAuth flow in your browser.
Credentials are stored in VS Code’s built-in secret storage (encrypted, per-profile). You stay signed in across sessions until you explicitly sign out.
Inline Diagnostics
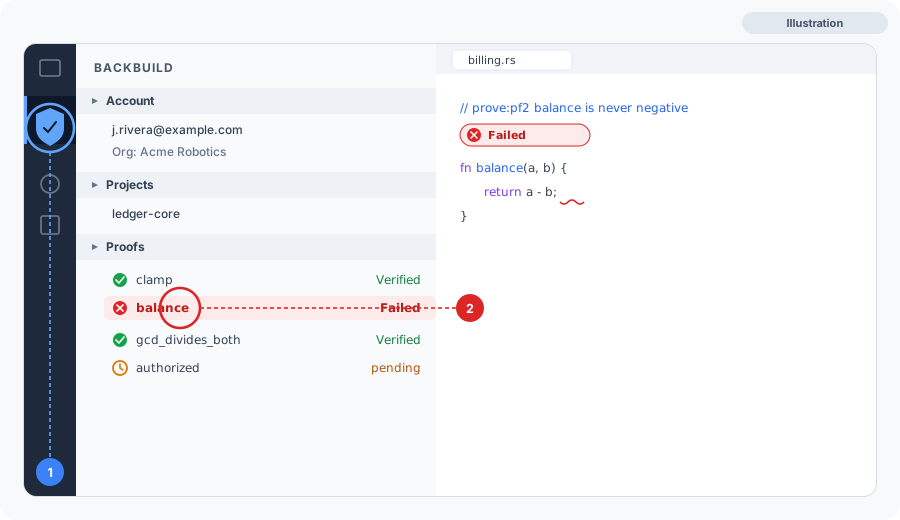
The core feature: failed proof annotations appear as inline diagnostics, exactly like type errors or linting warnings.
- Red/yellow squiggles: proof verification failed.
The error message identifies the failing step and what the kernel expected.
Severity is configurable: show failures as warnings during development and
as errors in CI (see
backbuild.severityModebelow). - Gutter and status indicators: verified annotations show a green status indicator; failing ones are flagged so you can see the verification state of a file at a glance.
AI coding agents working in the editor see these diagnostics automatically and can self-correct without human intervention.
CodeLens
CodeLens appears directly above each annotated function, showing its
verification status (verified, failed, or pending) inline in the editor.
The CodeLens doubles as a set of one-click commands so you can re-verify the
function, view its contract, or publish a certification without leaving the
code. CodeLens is on by default and can be toggled with
backbuild.showCodeLens.
One-Click Commands
Common actions are available as one-click commands from the Command Palette, the CodeLens above each annotated function, and the Backbuild sidebar:
- Verify: re-run verification for the current file or function.
- View contract: open the rendered pre/post contract and proof for an annotation.
- Publish: sign and publish a certification bundle for verified code.
Hover Tooltips
Hover over a proof annotation to see a tooltip rendering the annotation:
- The theorem name
- The proof statement, including any preconditions and postconditions
- The rendered LaTeX proof body (math rendered where the host supports it)
Verify on Save
When enabled (the default), the extension automatically re-verifies all pf2 annotations in a file every time you save. Verification runs in the background, so you can continue editing while results stream in.
Unchanged annotations are resolved from cache immediately. Only modified or new annotations are sent to the verification service.
Status Bar
A Backbuild item appears on the right side of the status bar:
- Signed in: shows the active account (your email). Click to switch between signed-in accounts. The tooltip lists how many accounts are available.
- Signed out: shows a shield icon labeled Backbuild. Click to open the Backbuild panel. The tooltip also reflects whether the language server is active.
Output Panel
The Backbuild output channel shows detailed activity logs:
- Verification activity and proof failures from the language server
- Error details for failed proofs
- Authentication and session keep-alive status
- Language server startup and installer progress
Open the Output panel (Ctrl+Shift+U /
Cmd+Shift+U) and select Backbuild
from the dropdown.
Backbuild Sidebar
The extension adds a Backbuild view to the Activity Bar (shield icon) with tree views for:
- Account: sign in, switch between multiple signed-in accounts, and select your active organization.
- Projects: import a repository as a Backbuild project, link to an existing project, or unlink the current folder.
- Proofs: a tree of the pf2 annotations in your workspace with their verification status, so you can navigate to a proof and see at a glance what is verified, failing, or pending.
Proof failures also surface inline in the editor as diagnostics (red/yellow squiggles) and as CodeLens above each annotated function.
Configuration
Extension settings are available in VS Code’s Settings UI under
Extensions > Backbuild Prove, or in
settings.json:
| Setting | Default | Description |
|---|---|---|
backbuild.severityMode | warning | Diagnostic severity for failing proofs: warning or error |
backbuild.verifyOnSave | true | Automatically verify a file when it is saved |
backbuild.showCodeLens | true | Show CodeLens above functions with proof annotations |
backbuild.apiBaseUrl | https://api.backbuild.ai | Backbuild API base URL |
backbuild.lspBinaryPath | (auto) | Override path to the bbprove-lsp binary (auto-detected if empty) |
These settings can also be set at the workspace level in
.vscode/settings.json to share them with your team.
Other Editors
Prove is not VS Code only. The verification experience is powered by the Backbuild Prove language server, so any editor with a Prove extension gets the same core loop: inline diagnostics, verify-on-save, and navigation to failing proofs. Alongside Visual Studio Code (which also runs in Cursor, Windsurf, and other compatible editors through Open VSX), Prove ships extensions for:
- JetBrains IDEs (IntelliJ IDEA, PyCharm, GoLand, WebStorm, and the rest of the family)
- Neovim
- Emacs
- Zed
- Sublime Text
- Eclipse
- Visual Studio
- Xcode
- Qt Creator
Because they share one language server, the diagnostics and verification behavior are consistent across editors. The exact set of convenience features (such as CodeLens or tree views) depends on what each editor's extension API exposes.
Which editors are supported: VS Code, JetBrains, Neovim, Zed, Cursor, Windsurf?
All of them. Visual Studio Code is on the VS Code Marketplace and on Open
VSX, so it also installs in Cursor and Windsurf. Prove additionally ships
extensions for the JetBrains family, Neovim, Emacs, Zed, Sublime Text,
Eclipse, Visual Studio, Xcode, and Qt Creator, all backed by the same
language server.
What if the language server is not available on my machine?
The extension falls back to verifying through the backbuild-cli,
so verification still works. Keep the backbuild binary on your
PATH. See Troubleshooting.
Do AI agents in my editor see the diagnostics?
Yes. Failed proofs surface as standard editor diagnostics, so an AI agent
working in the editor reads them and self-corrects without a human
prompt.
Next Steps
- Getting Started: install and verify your first annotation
- Writing pf2 Annotations: syntax reference
- CLI and CI: command-line verification and CI integration
- Project Settings: severity modes and exclusion patterns