

Track Business Locations with Custom Views
You run more than one location (stores, branches, kiosks, franchises) and you are tired of tracking them in a spreadsheet that nobody trusts. This guide turns that network into real structured data in your workspace and gives you saved views that answer the questions you actually ask, like which locations are open and what is planned next. For a revenue-by-region breakdown or a chart, you will pull the numbers into Backbuild Sheets, which is live now. After this page you will have a Location data model, real location records, a set of saved views you can return to any time, and a Sheets chart of revenue by region, all live in Backbuild.
Custom data modeling (entity types, entities, relationships, and views) is included on every plan, including Free. See the pricing page for current details.
What You Will Build
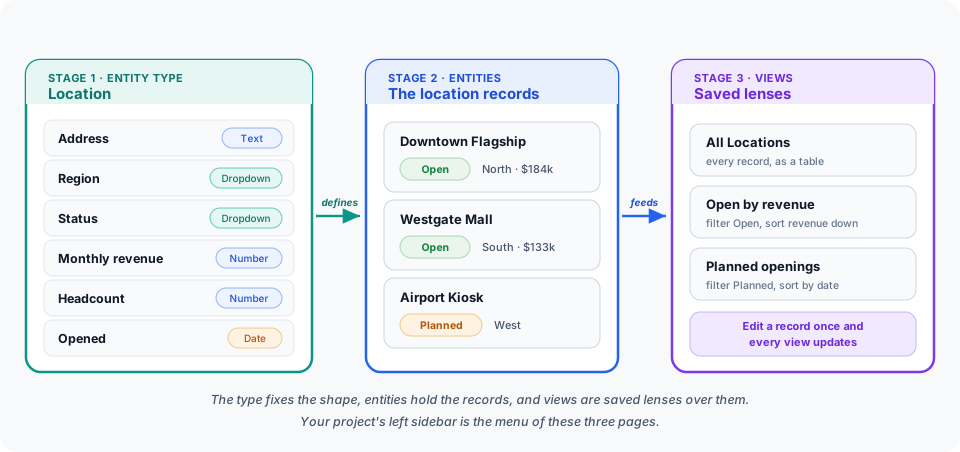
After this section you will understand the shape of the job. Structured data in Backbuild has three parts, and you build them in order:
- An entity type called Location, which defines the shape of a location record: the fields every location has (address, region, status, revenue, and so on).
- Entities, the actual location records (your Downtown flagship, your Westgate mall unit, your airport kiosk), each holding real values in those fields.
- Views, saved lenses over those records that filter, sort, and group them, so "open locations, highest revenue first" is one click instead of a rebuild.
Prerequisites. You need a Backbuild workspace. That is all. If you are new, run through Getting Started first, then come back.
Step 1: Create a Project
After this step you will have a home for this data. A project is the container your locations, their views, and everything related to them live in.
- In the left sidebar, open Projects, then choose New project.
- Name it something clear, for example "Store Network," and create it.
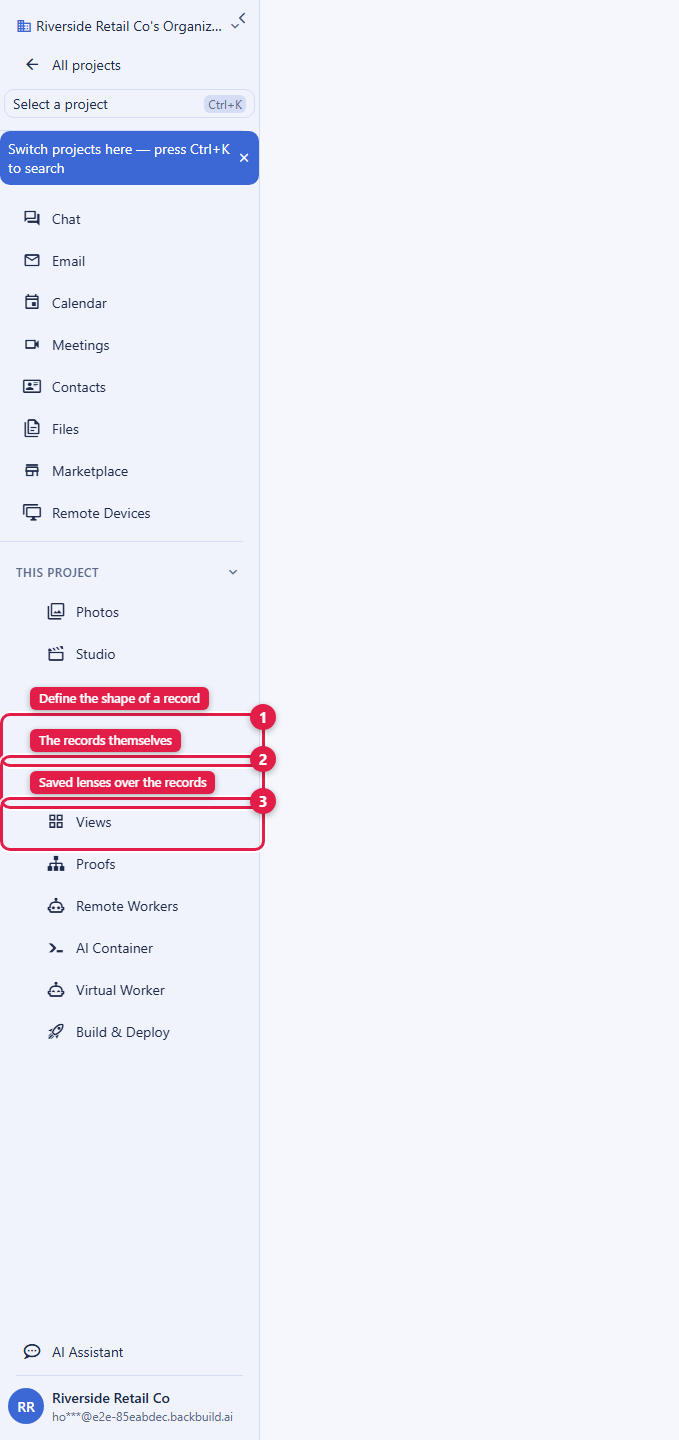
- Open the project. You land in the project shell, and the left sidebar now shows a "This Project" group. That group is your menu of pages for this project's data: Entity Types, Entities, and Views, alongside the project's other tools. You will move between those three pages throughout this guide.
Step 2: Define the Location Entity Type
After this step you will have defined the shape of a location. The entity type is where you list the fields every location record will carry.
- In the project's This Project sidebar group, open Entity Types, then create a new type and name it Location. (You can also reach the type editor from Settings, then Entity Types, if you would rather manage types for the whole organization in one place.)
-
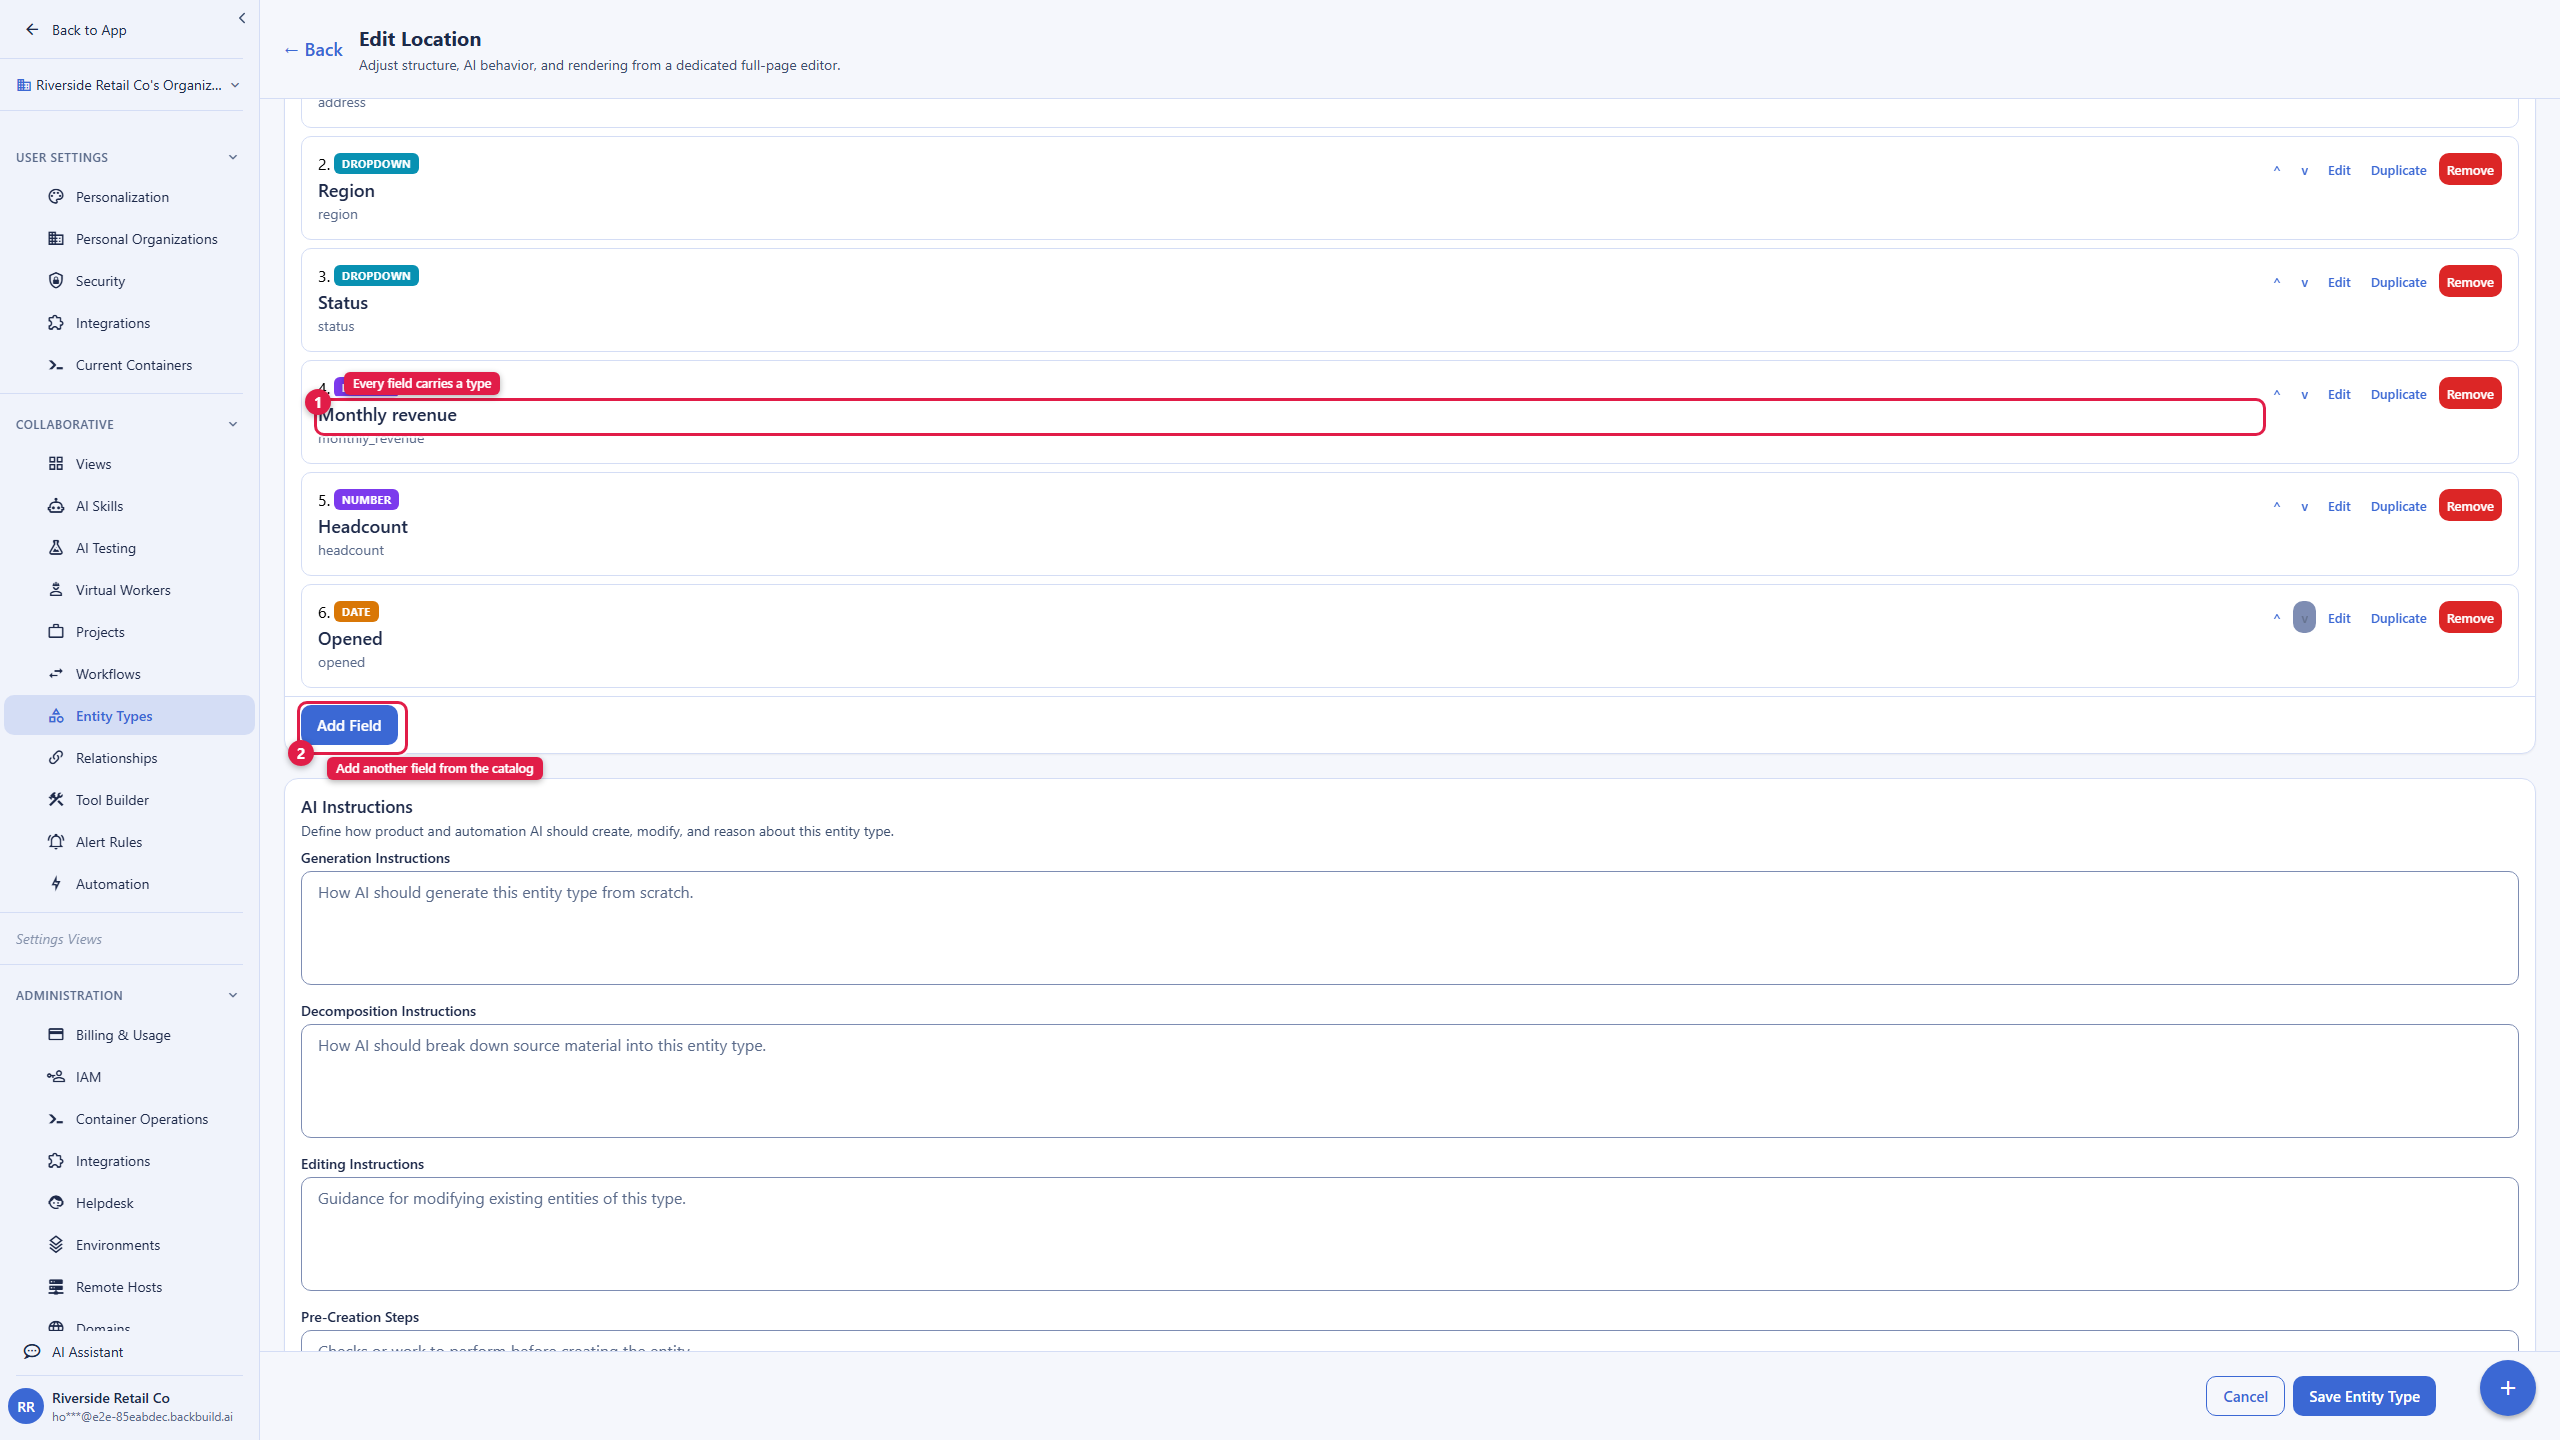
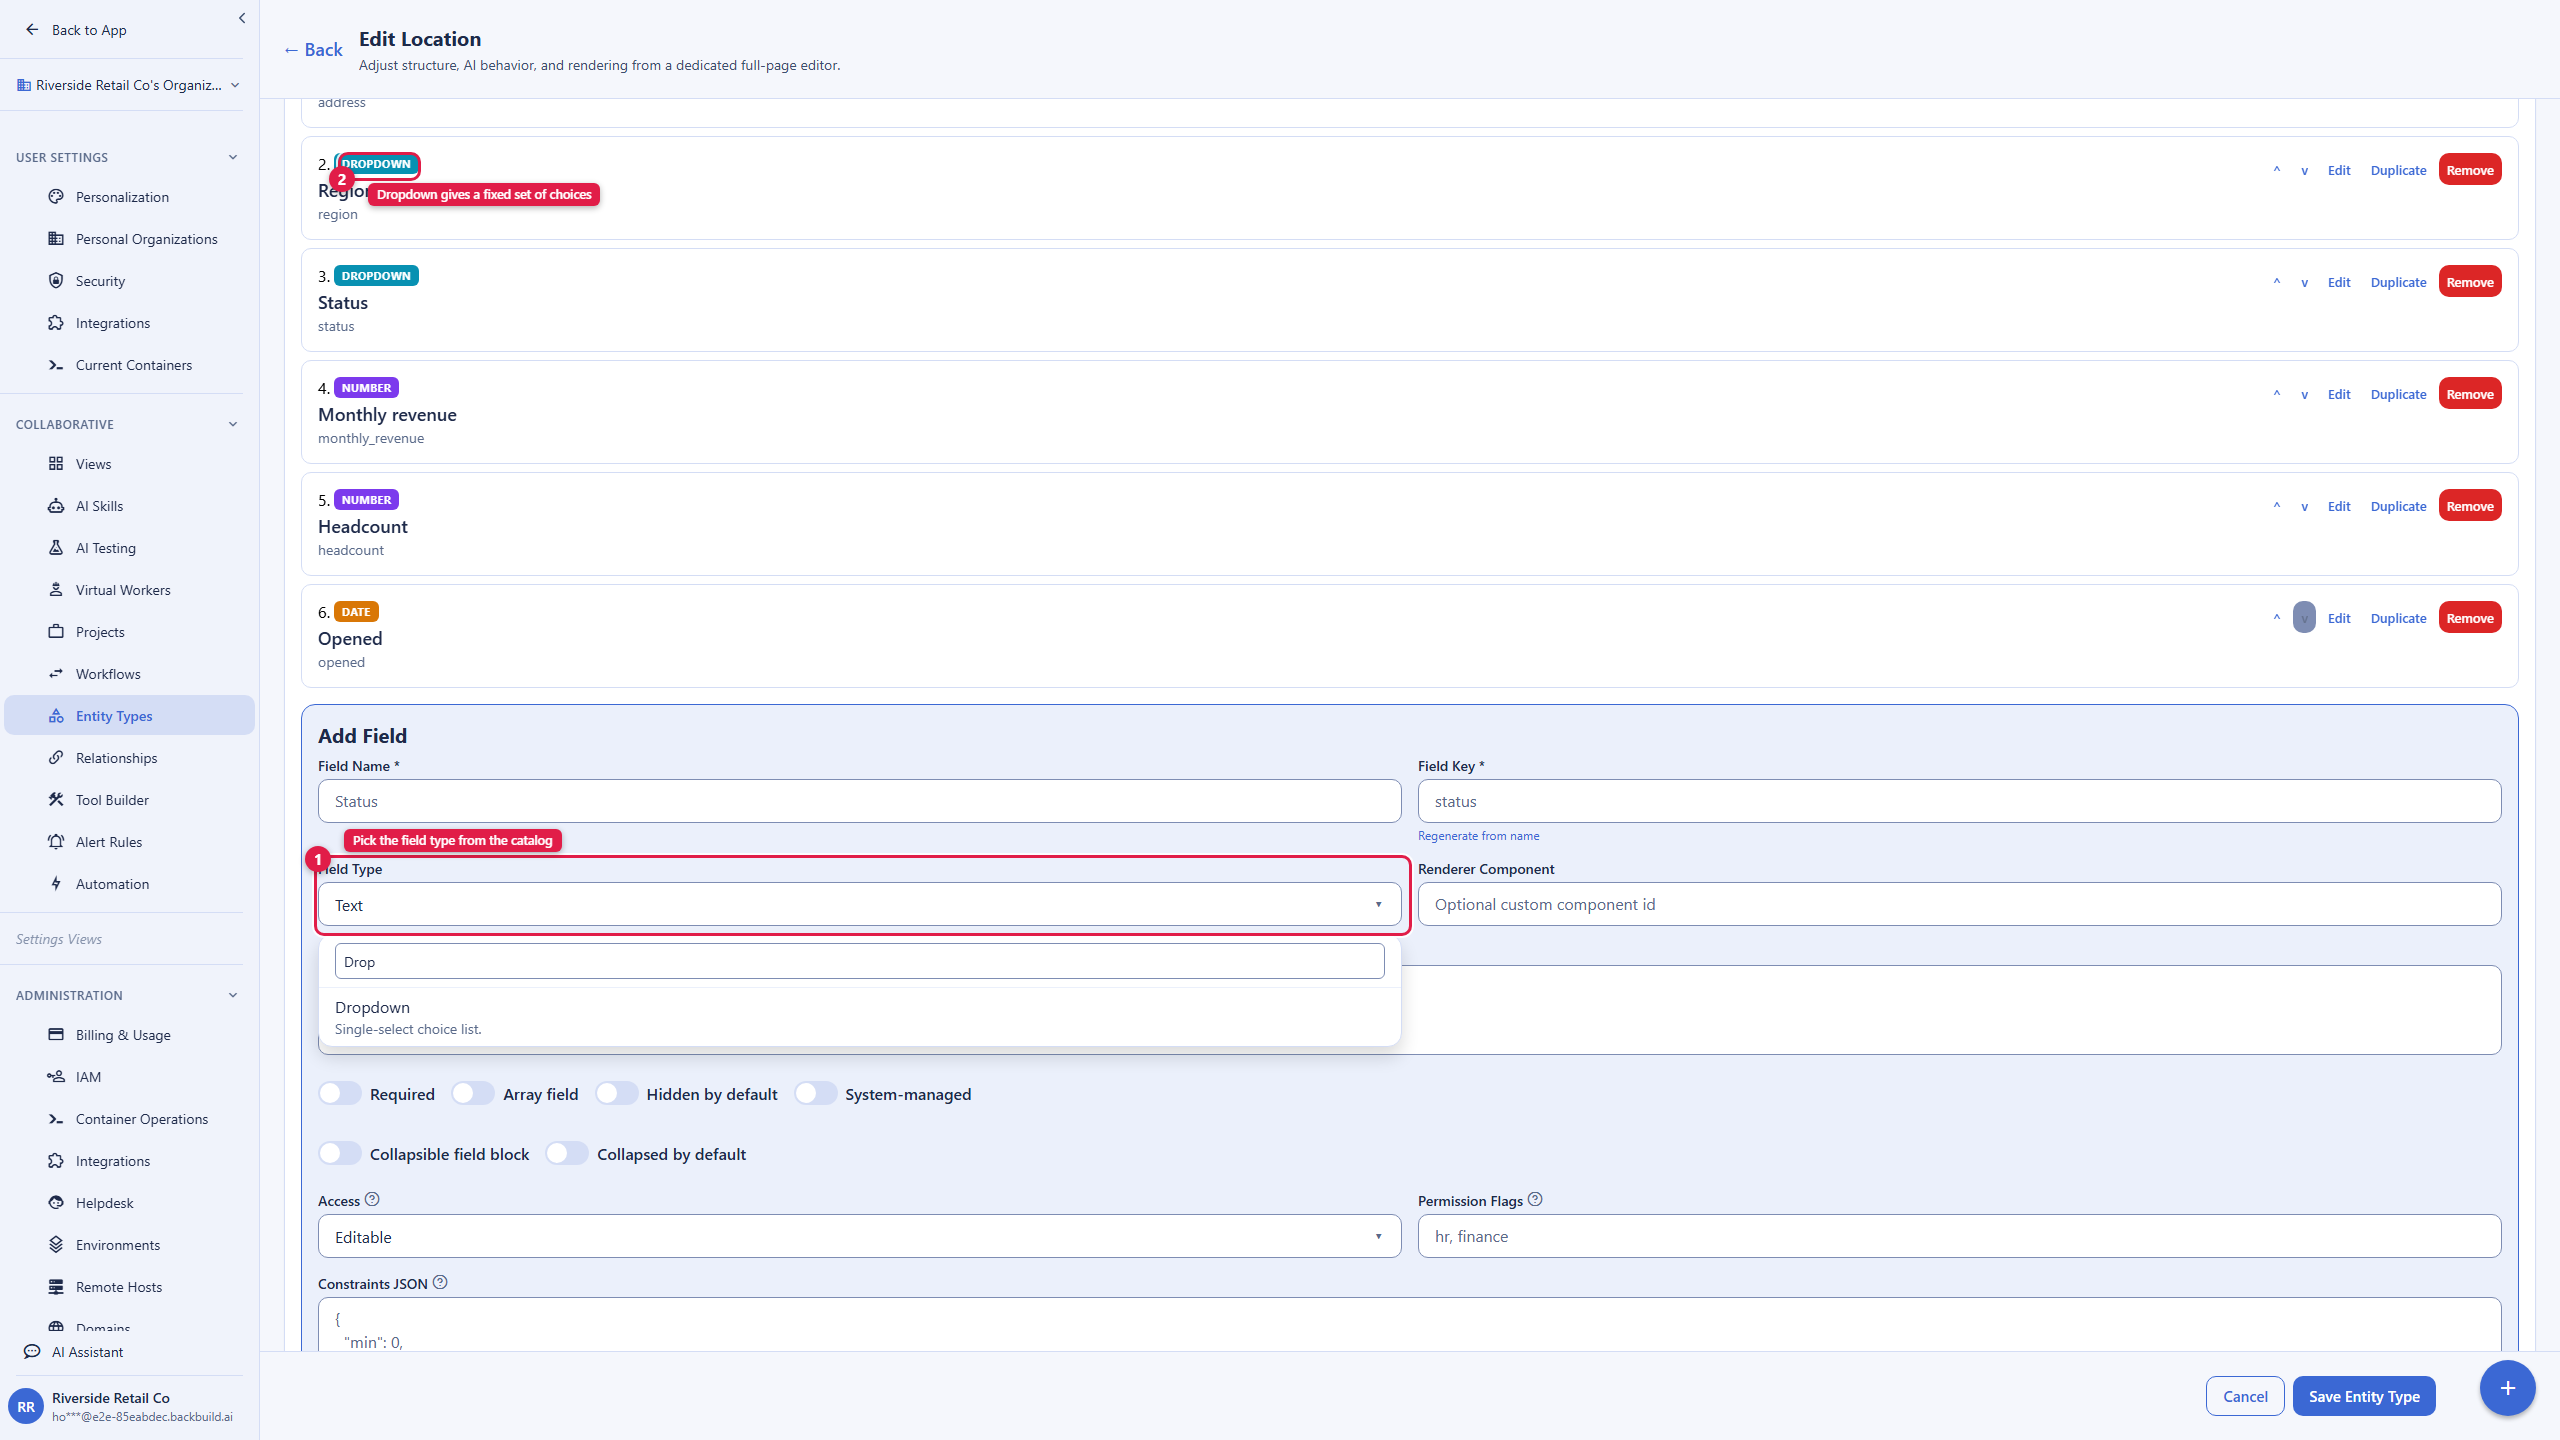
Add the fields you want to track. For each field you give it a name and pick
a field type from the catalog. A practical Location schema:
Field Field type Why Address Text The street address of the location. Region Dropdown A fixed set of choices (for example North, South, East, West) so you can group and filter cleanly. Status Dropdown Open, Planned, or Closed, so you can see the live network at a glance. Monthly revenue Number What each location brings in, so you can sort and compare. Headcount Number How many people work there. Opened Date When the location opened (or is planned to). - Save the type. The record's own name is built in (use it for the location's name, for example "Downtown Flagship"), so you do not add a name field yourself.
Those are only the field types this example needs. The catalog is much larger, covering text, number, date and time, boolean, dropdown and radio choices, markdown, links and email, images and attachments, references to other records and to people, rollups, and more. The full list and how each behaves is in Entity Types. Picking the right type matters: a Dropdown for Region gives you clean grouping later, where a free-text region would let "North," "north," and "N." drift apart.
Step 3: Add Your Locations
After this step you will have real records to look at. Now you create one entity per location and fill in its field values.
- In the This Project sidebar group, open Entities, then choose Create entity.
- In the create dialog, give the location a Name (for example "Downtown Flagship") and pick the Location entity type. Submit.
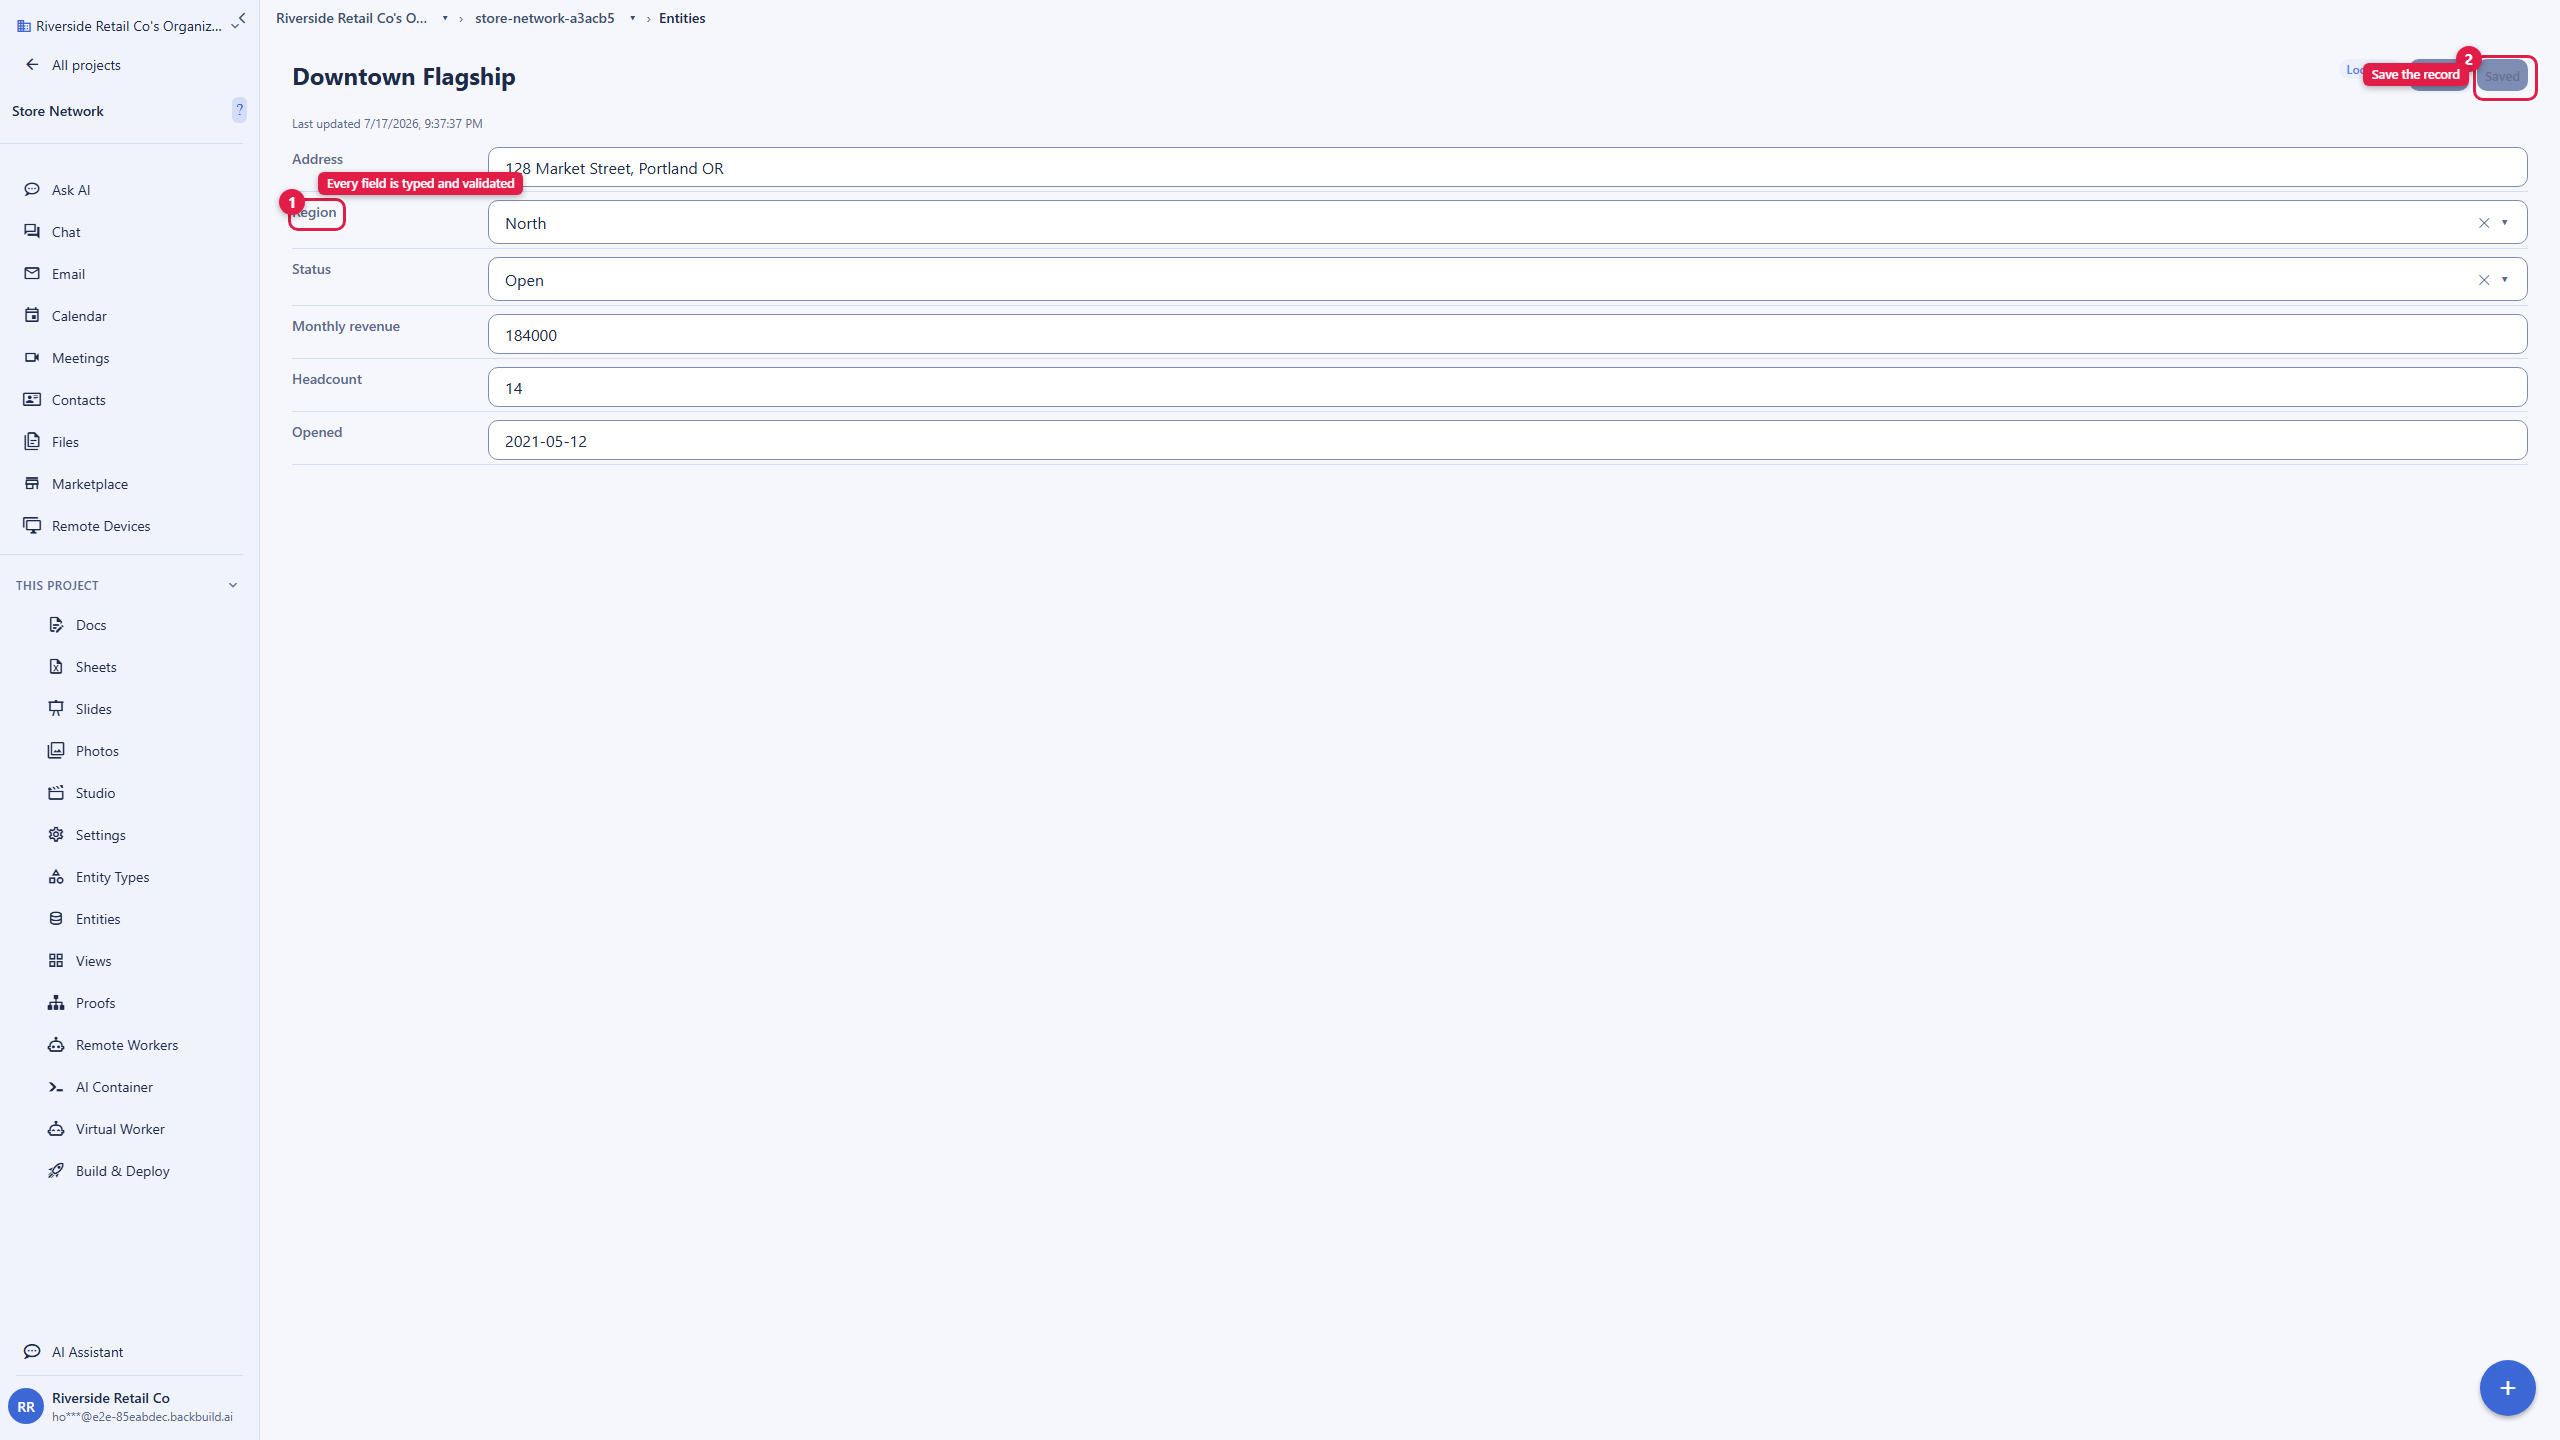
- You now open the location's detail page, where you fill in the field values: the address, pick the region and status, enter the monthly revenue and headcount, and set the opened date. Required fields are enforced, so a missing one shows "This field is required" until you fill it. Save.
- Repeat for several locations. Seed a realistic mix so your views have something to show, for example a Downtown Flagship that is Open, a Westgate Mall unit that is Open, and an Airport Kiosk that is Planned, spread across a couple of regions with different revenue.
Splitting creation into two moments (name and type first, then the field values on the detail page) is deliberate: you can add a location quickly, then fill in the details when you have them.
Step 4: Build Views That Answer Your Questions
After this step you will have saved lenses over your locations. A view saves a way of looking at your records so you never rebuild the same filter and sort. There are two places to build one, and you will use both.
The quick in-project view
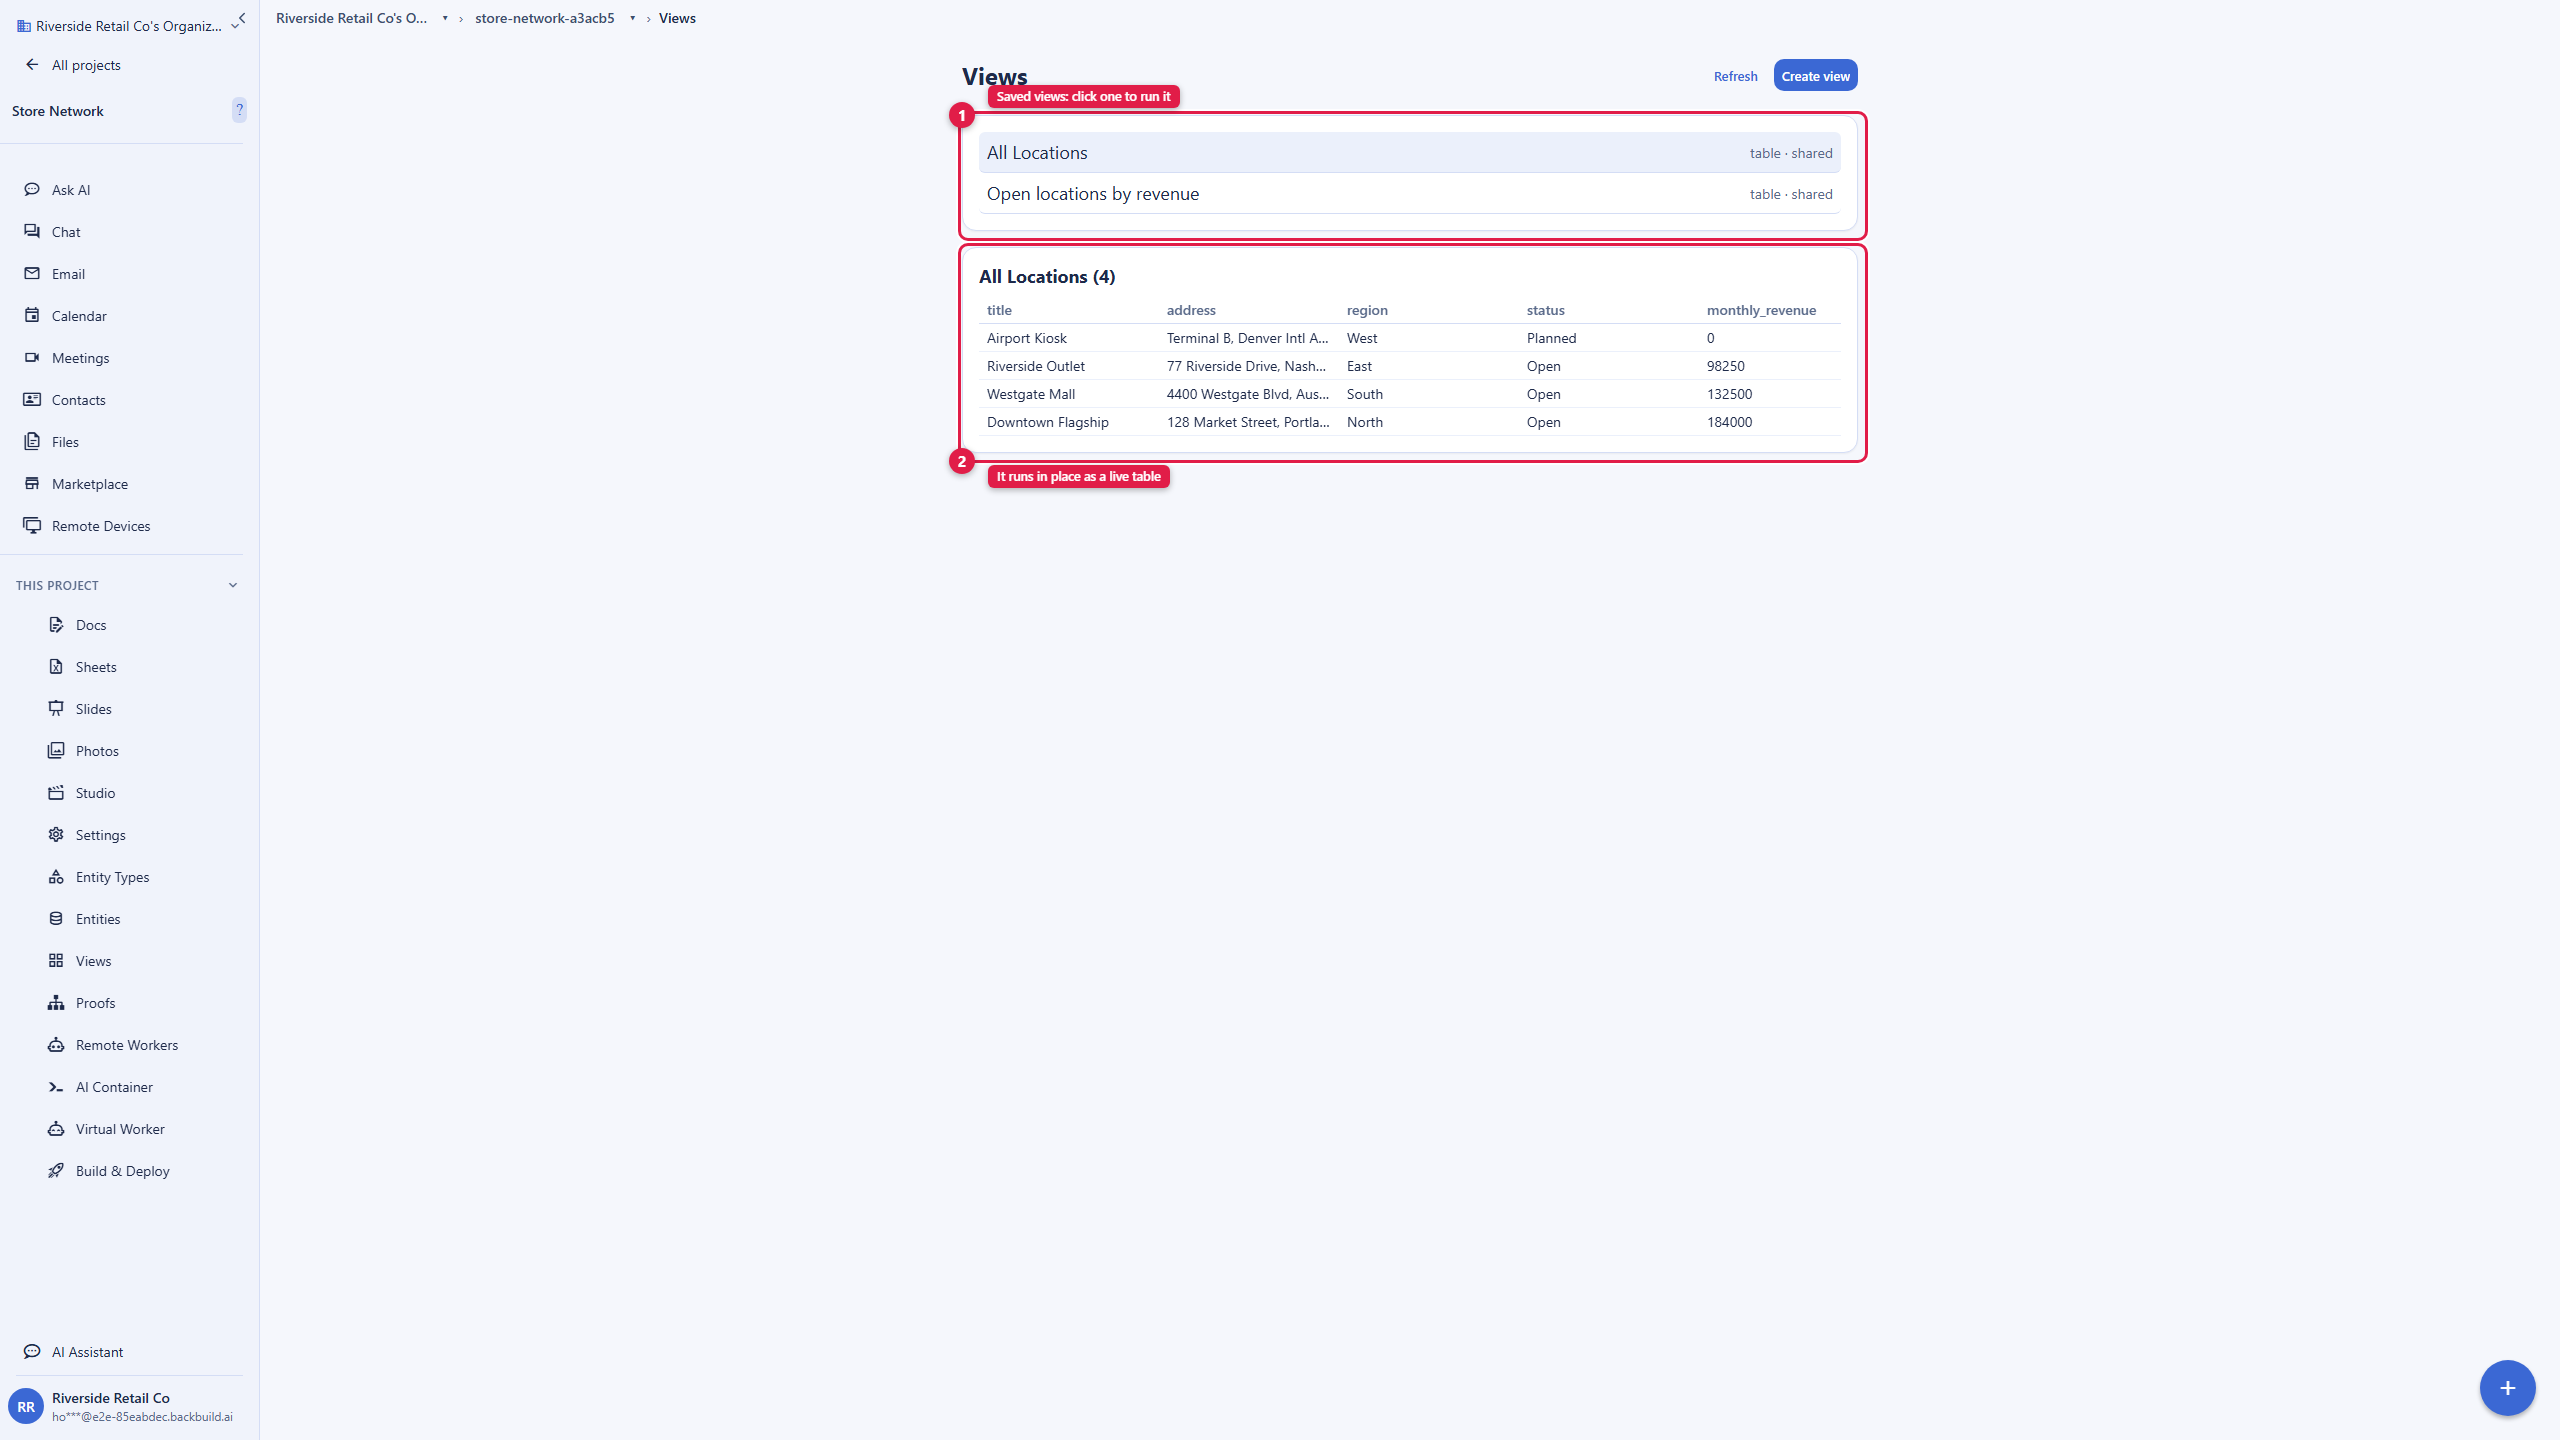
In the This Project sidebar group, open Views, choose Create view, name it (for example "All Locations"), and pick the Location entity type. Save it. Click the saved view and it runs, showing your locations as rows in a table with a column per field. This is the fastest way to get a live table of everything.
The focused view builder
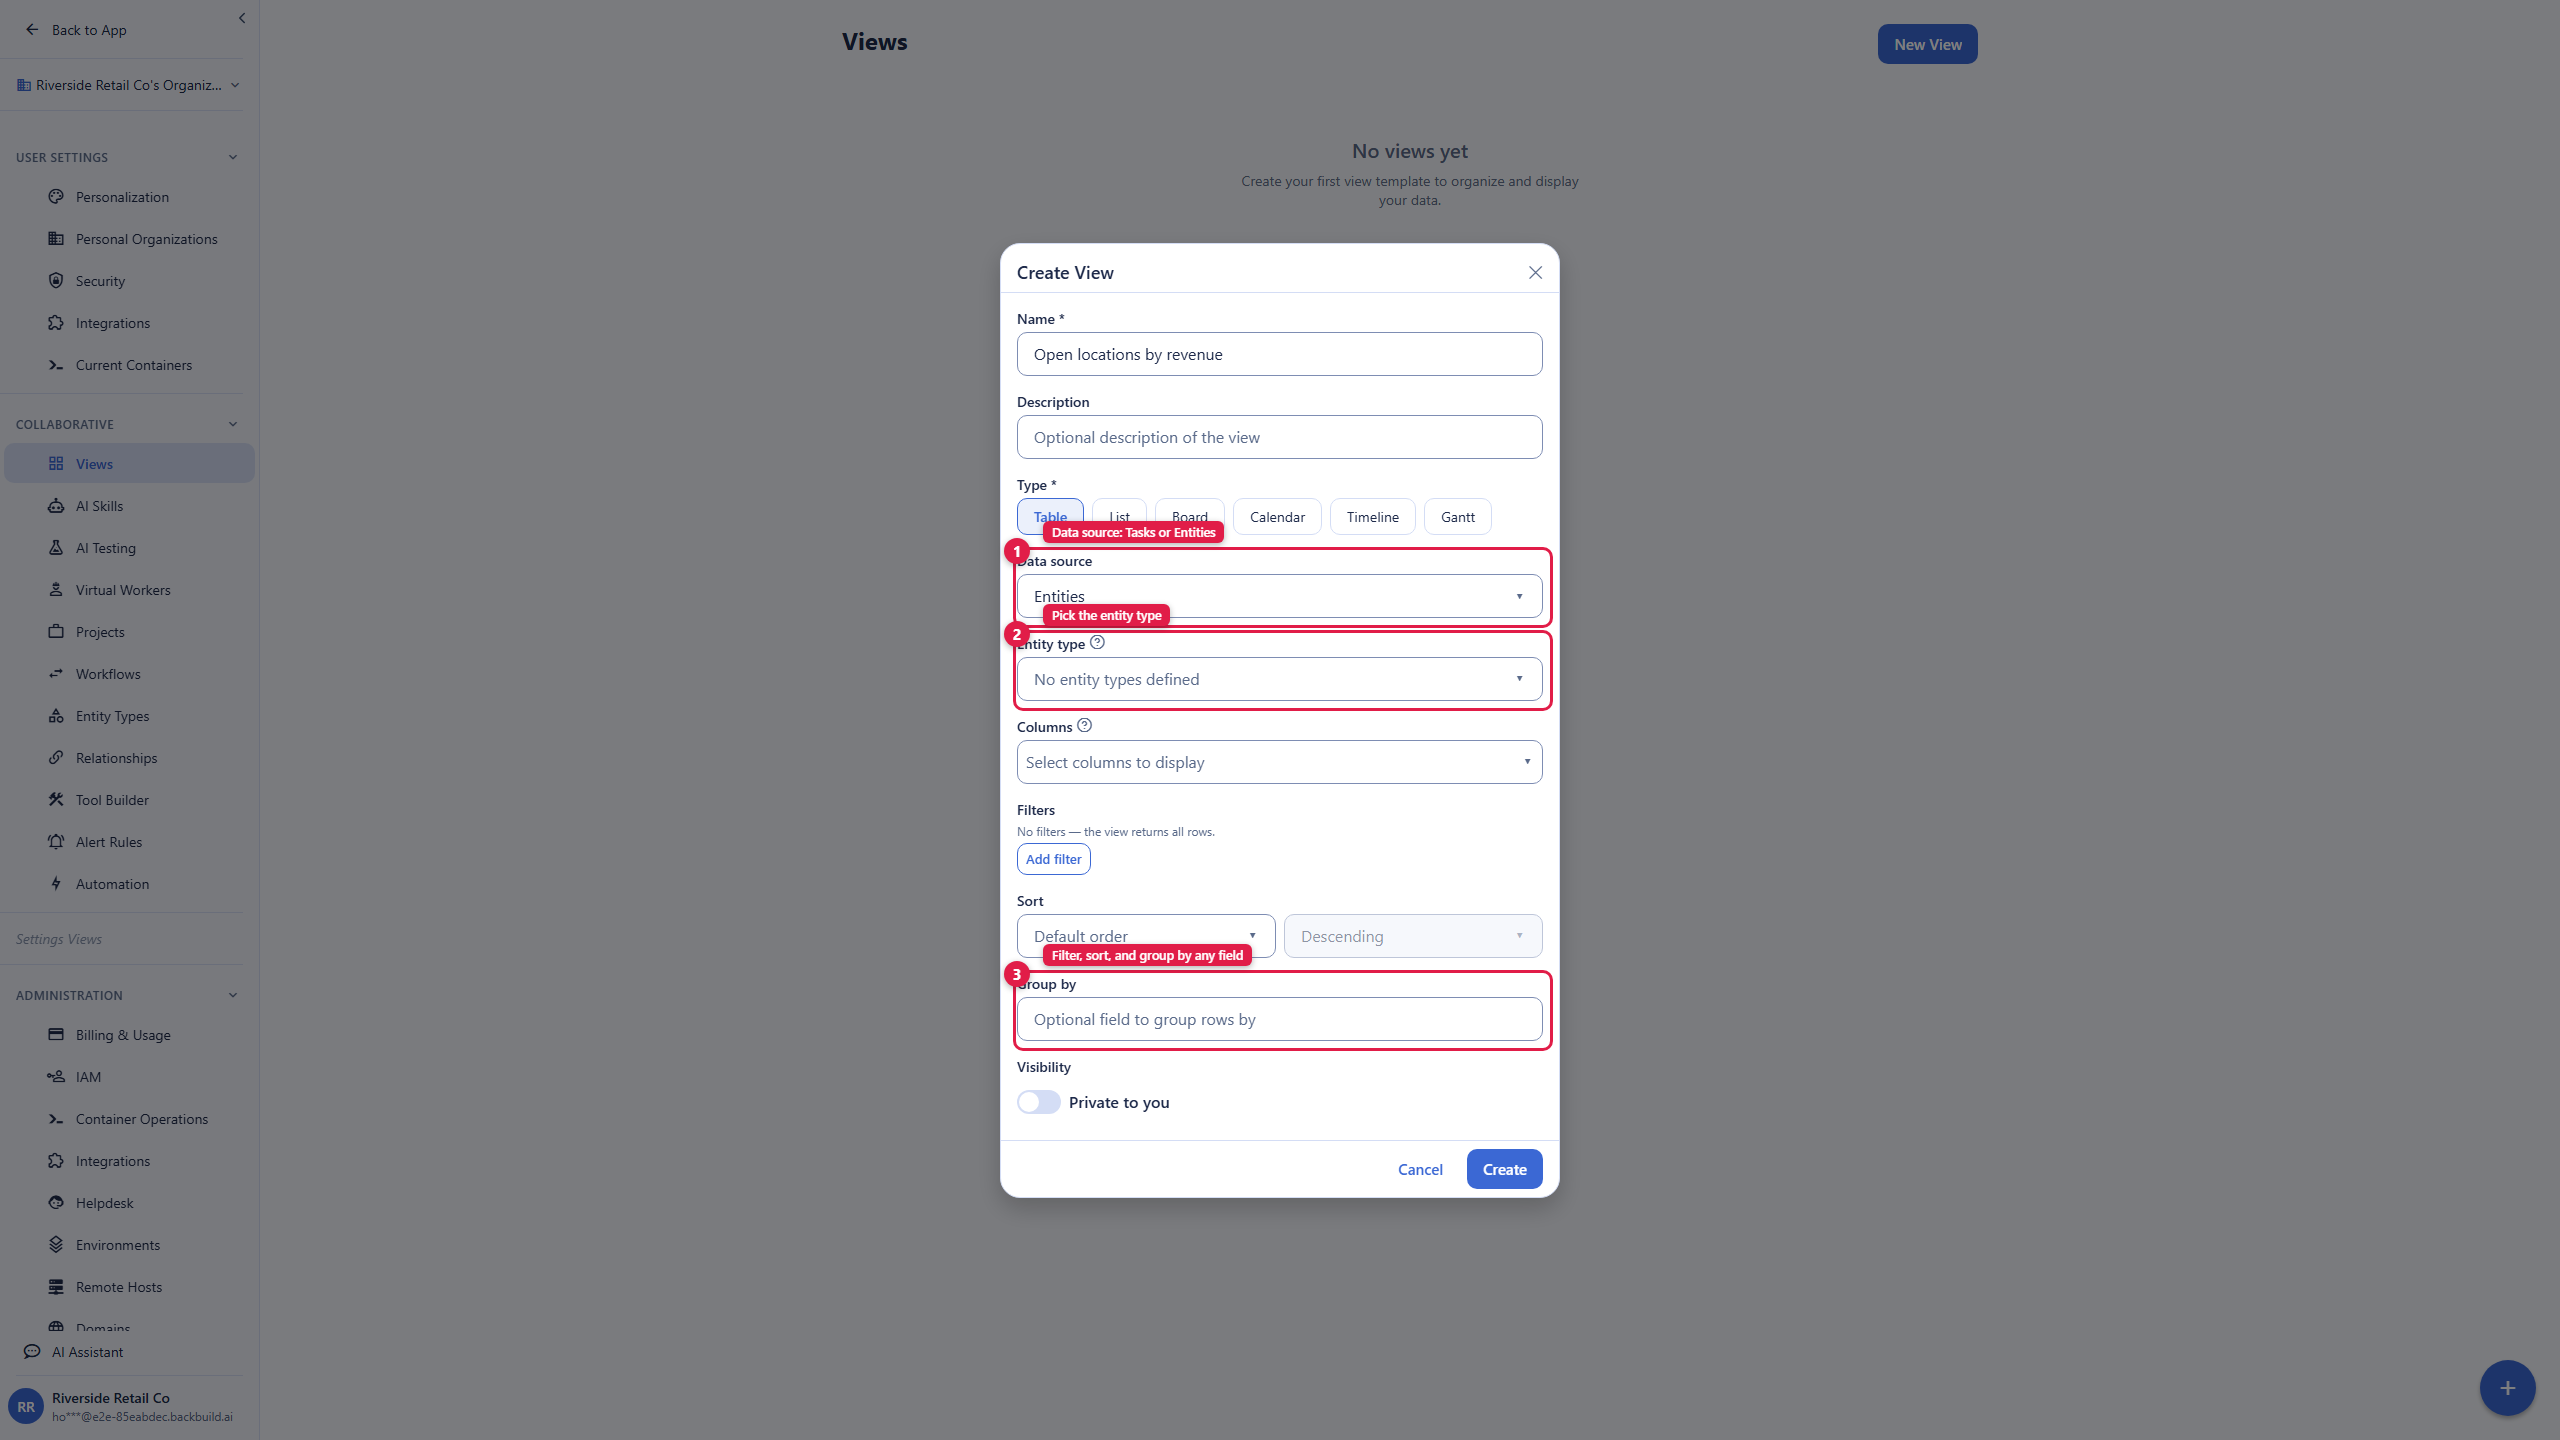
For a view that answers a specific question, use the richer builder. Open Settings, then Views, and choose New View. Here you set:
- Data source: choose Entities.
- Entity type: Location.
- Columns: the fields to show, in order.
- Filters: narrow the records, for example Status is Open.
- Sort: a field and direction, for example Monthly revenue, descending.
- Group by: a field to group the view by, for example Region.
- Visibility: keep it private to you, or share it with your organization.
Two focused views worth saving: "Open locations" (filter Status is Open) shows your live network, and "Planned openings" (filter Status is Planned) is your pipeline. Filters are what shape a saved view's records today. To rank a list by a number like revenue, or to break it down by region, take the values into Backbuild Sheets (below), which is live now. Because every view reads the same records, editing a location updates it in all of them at once; you never keep parallel copies in sync. The full reference is in Views.
How views look today. In the Backbuild app right now, a saved view opens as a paginated table whatever type you pick, with your chosen columns and your filters applied. A Sort or a Group by you set is saved on the view, but the run-in-place table does not reorder or cluster the records by it yet, and dedicated board, calendar, timeline, and gantt layouts are coming; see how view types render today. There is also no chart or breakdown view type yet: to rank records by a number, break revenue down by region, or draw a chart, pull the values into Backbuild Sheets and work with them there, which is live now.
The revenue-by-region breakdown
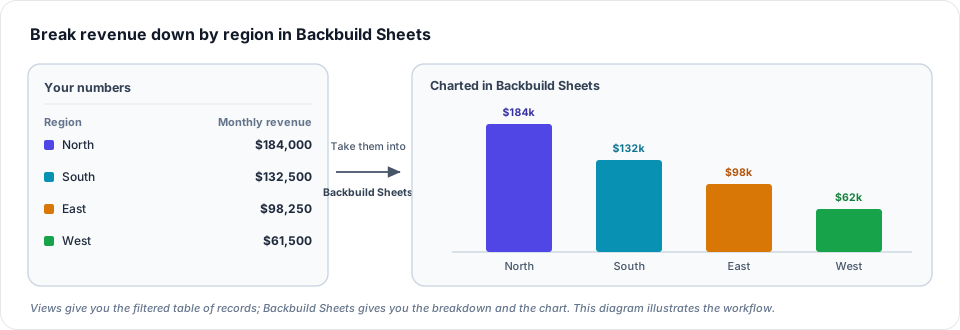
After this step you can read revenue by region. A saved view gives you the filtered table of your locations, but it does not group or rank the records on its own today, so the live way to break revenue down by region, and to draw a chart, is Backbuild Sheets, which is live now. Put each region and its revenue into a sheet, then insert a chart: a few columns and a couple of clicks turn the same numbers into a bar chart you can compare at a glance. The full walkthrough, with real screenshots, is in Charts in Backbuild Sheets.
Step 5: Move Between the Pages of Your Data
After this step you will know how to navigate your structured data. Your project's left sidebar, the This Project group, is the menu of pages for this data. You switch among Entity Types (where you define the shape), Entities (where the records live), and Views (your saved lenses) from that persistent group, alongside the project's other tools. Inside the Views page, each saved view is a row you click to run and read inline. That is the whole navigation model: the sidebar is the menu, and a view runs in place when you open it.
If you want a fully custom sidebar of screens over this data (your own app chrome, with named pages you design), that is what the SaaS Builder is for, part of Backbuild Pro. It packages your data model into an installable product with its own screens. For tracking your own locations, the project's This Project group and saved views above are all you need, and they are free on every plan.
Troubleshooting and FAQ
I do not see Entity Types, Entities, or Views in my project sidebar. Open your locations from Settings instead: Settings, Entity Types to define the Location type and Settings, Views to build views. The same data model is reachable both ways.
My view shows a table even though I picked a board or calendar. That is expected today. Saved views render as a paginated table in the app for now, with the type saved on the view; dedicated board, calendar, timeline, and gantt layouts are coming. See how view types render today.
Can I make a chart, like revenue by region? Not as a view type yet, and a saved view does not group or rank the records on its own today. To break revenue down by region or draw a chart, put the numbers into Backbuild Sheets and chart them there, which is live now. Views give you the filtered table of records; Sheets gives you the breakdown and the chart.
I filled in the create dialog but my address and revenue are not there. The create dialog takes only the name and the entity type. You fill the field values (address, region, revenue, and the rest) on the location's detail page after it is created.
My Region values are inconsistent, with "North" and "north" as separate entries. Use a Dropdown field for Region rather than free text, so every record picks from the same fixed set of choices. Clean categorical values keep your filters exact and your Backbuild Sheets breakdowns tidy. You can change the field type on the entity type and re-enter the values.
If I share a view, can teammates see locations they should not? No. Sharing a view shares only its definition (its columns, filter, and sort). Every time anyone runs it, the records are re-checked against what that person is allowed to see. See Views for the sharing model.
Next Steps and Related Docs
- Entity Types: the full field-type catalog and how to design a type.
- Entities: creating, editing, and organizing records, and how record visibility works.
- Views: every view type and setting, view templates, sharing, and execution.
- Relationships: link a location to related records (a manager, a region record, or a lease) with typed references, lookups, and rollups.
- Projects: how projects organize your data and who can reach it.
- Charts in Backbuild Sheets: turn your location numbers into a chart today.